Notes: Effective applied tariff is sourced from TRAINS Database through WITS and is UNCTAD adjusted. GDP per capita is computed using output-side real GDP at current PPPs (in mil. 2017US$) and Population (in millions) from PWT10.0.
Summary:
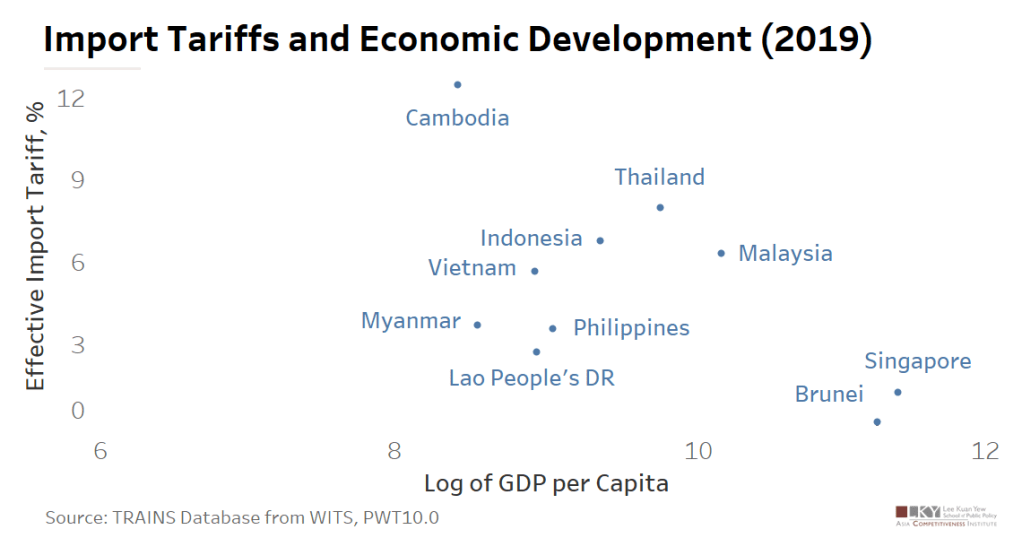
This week’s chart displays the negative correlation between a country’s per capita income and the level of import tariff it adopts. The pattern is persistent over time and is evident among the ASEAN countries. The causality can go either way. Evidence has shown that international trade can benefit economic growth by fostering specialization and making use of comparative advantages. Meanwhile, countries have incentives to impose discriminatory tariffs on trading partners due to the knowledge diffusion carried by trade.
Highlights:
- Singapore and Brunei are the most developed countries in ASEAN that impose low trade barriers on trading partners.
- Cambodia has the lowest GDP per capita among the ASEAN countries and imposes the highest import tariff on average.
Article By Chi ZHANG
Graphic By Yixuan GE
