Summary:
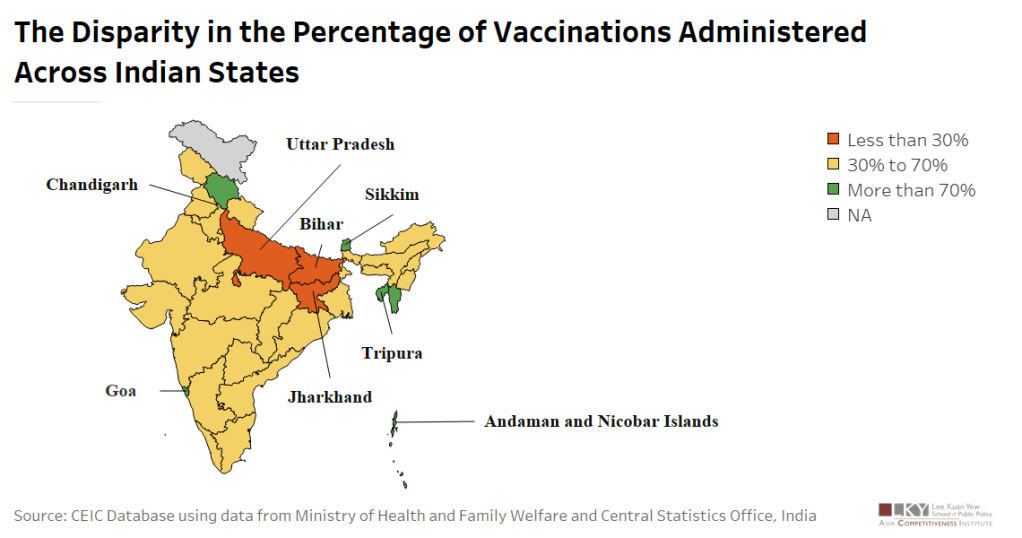
There is a stark disparity in the percentage of COVID-19 vaccine doses administered across Indian states. At the aggregate level, around 513 million total vaccine doses have been administered. However, this week’s chart shows that percentage of doses calculated by dividing the total doses administered by the latest estimated population available is more than 70% across some states while the figure is way below 30% in certain states.[1]
Highlights:
- As of 9 August 2021, Sikkim and Goa have the highest percentage of doses administered at 97% and 89%, respectively.
- Other smaller economies of Andaman and Nicobar Islands, Tripura and Chandigarh also have rates higher than 75%.
- At the other end of the spectrum, Uttar Pradesh, which has the highest population and the highest number of vaccine doses, has managed to achieve only 23% coverage.
- Jharkhand and Bihar, which are largely economically backward states that rank in the bottom of the state health index by NITI Aayog, also have coverage below 30%.
[1] This is based on the definition by Geographic Insights Dataverse, Harvard University.
Article By Sumedha GUPTA
Graphic By Yixuan GE
